![LOGO_WV-1.png]](https://help.martianlogic.com/hs-fs/hubfs/LOGO_WV-1.png?height=40&name=LOGO_WV-1.png)
Phase 1: Query the AI Analytics Tool
Step 1.
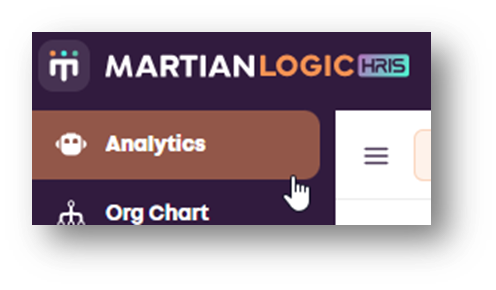
Click AI Analytics at the top of the screen to open the tool.
Step 2.
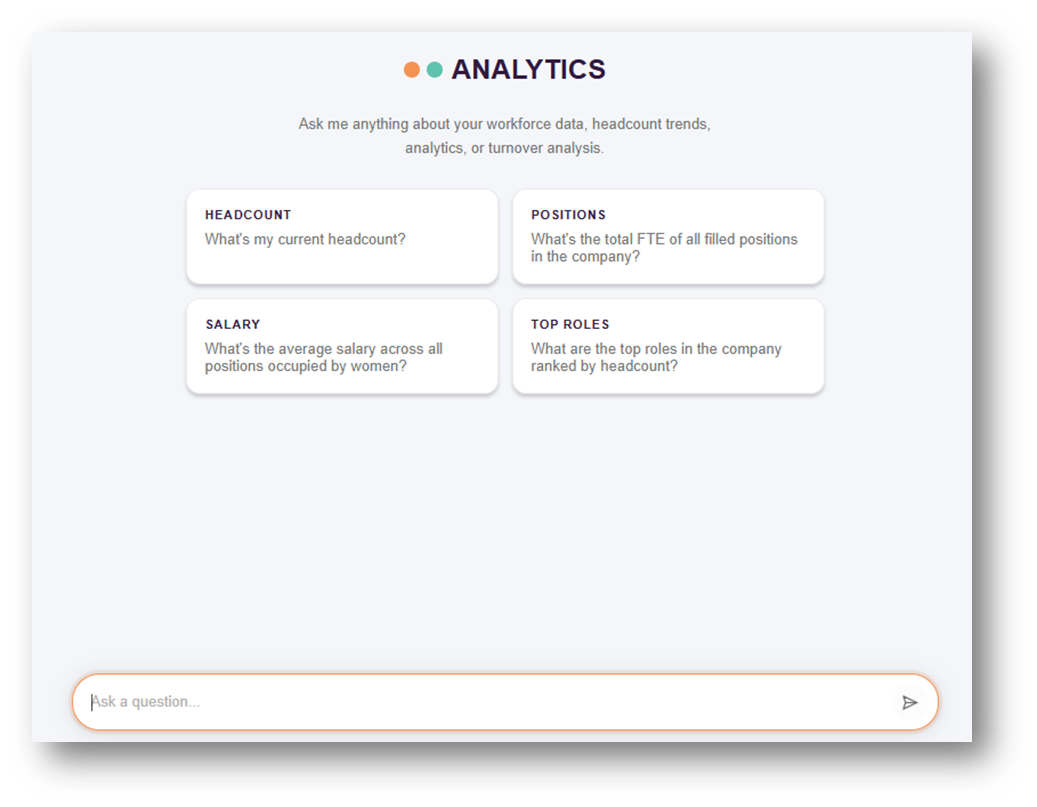
Select a report using one of the following methods:
- Method A (Suggested Prompts): Click one of the pre-loaded suggestions (e.g., click Headcount Report to automatically calculate workforce data).
- Method B (Custom Query): Click Start a new conversation on the side panel, type your specific question into the chat prompt (e.g., show me my gender), and press send.
Phase 2: Customize and Filter the Report
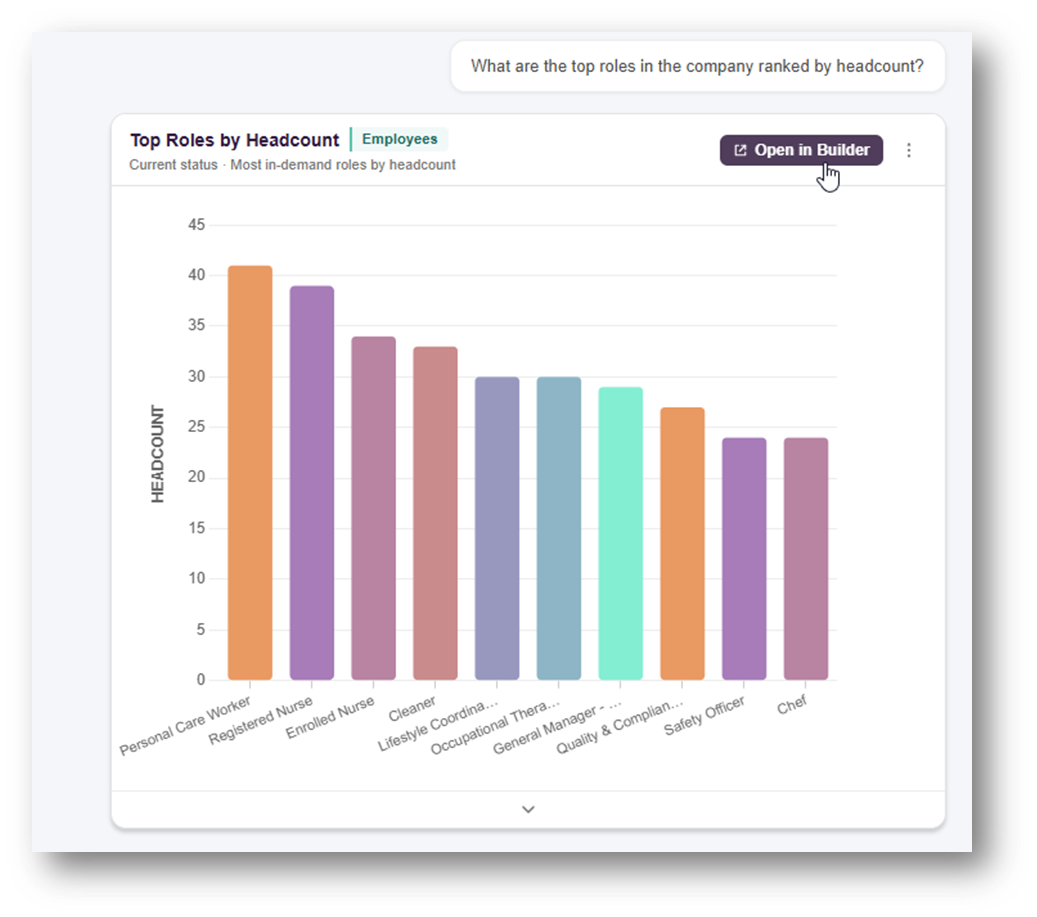
Step 3: Click Open in Builder on the generated report to access advanced customization options.
Step 4: (Optional) Change the visual layout by clicking your preferred chart type (e.g., Line, Stacked, or Pie).
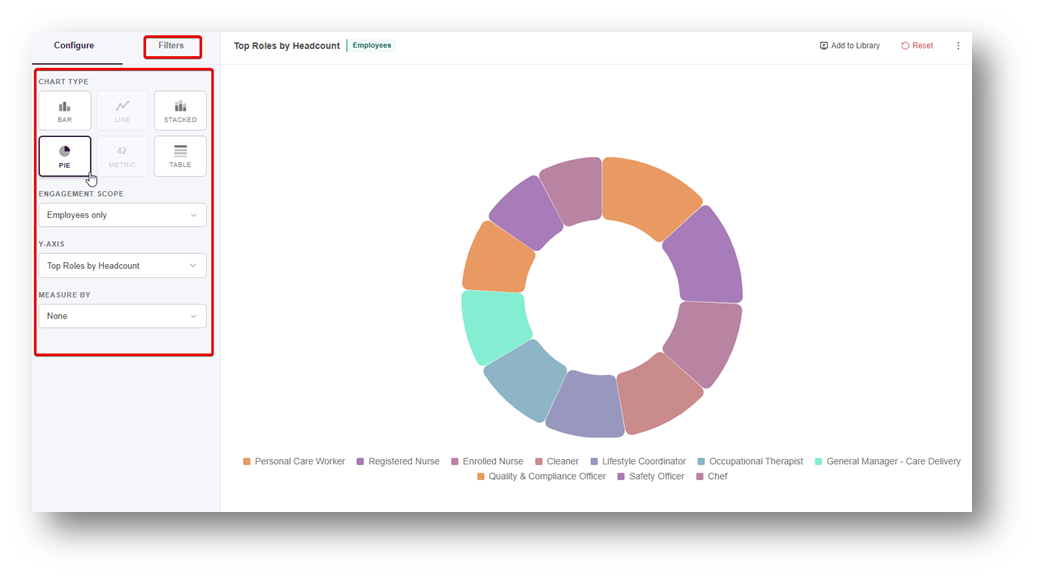
Step 5: Use the breakdown filters beneath the chart to refine the data:
- Change the primary metric category (e.g., switch from Gender to Department or Division).
- Change the measurement breakdown (e.g., filter by Employment Type).
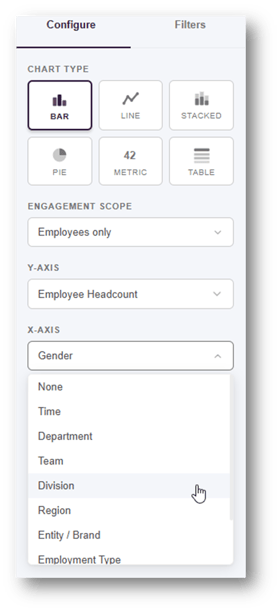
Step 6: (Optional) For advanced targeting, navigate to the next section, click Add Filters, select either Match All or Match Any, and define your custom filtering criteria.
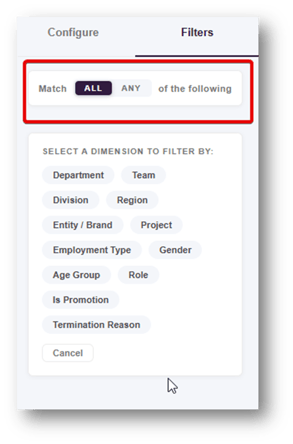
Phase 3: Save and Export Reports
Step 7: To keep a report for future use, click Add to Library.
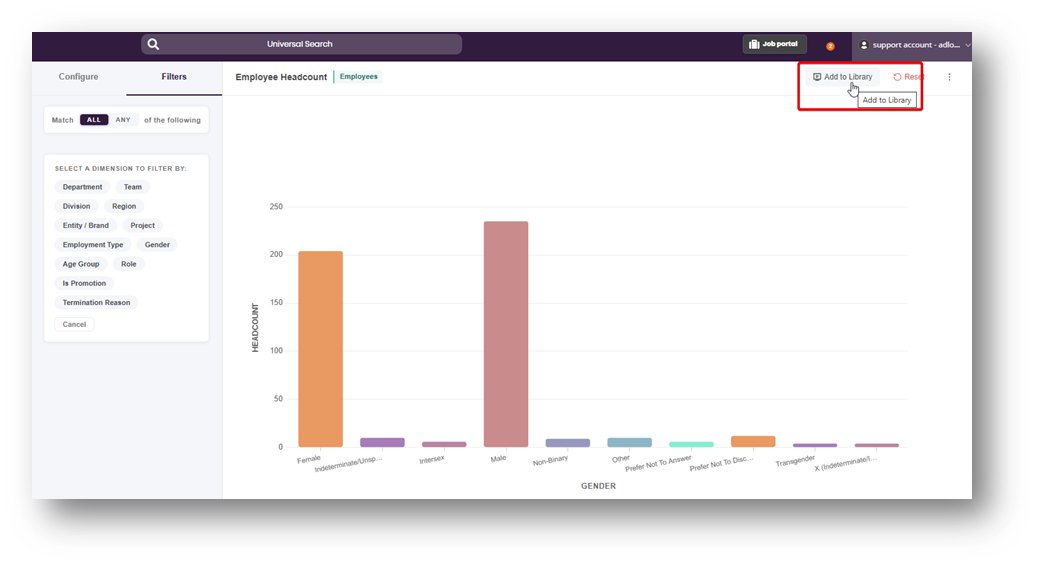
Step 8: Keep the default name or enter a custom name, then click Save. (Note: You can revisit this data anytime by clicking the saved report in your library).
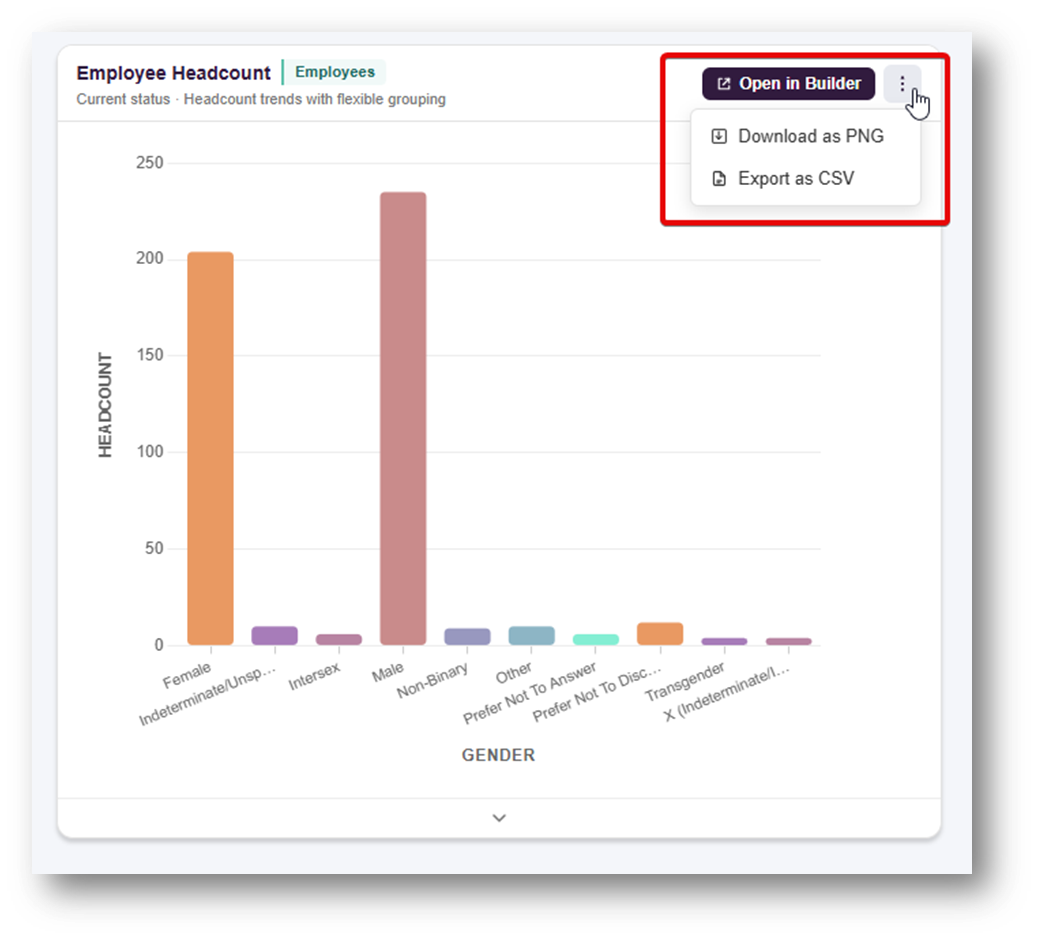
Step 9: To export your data, choose one of the following options:
- Download as a Picture: Saves a visual snapshot of the chart.
- Download as an Exported Spreadsheet: Generates an Excel file containing the raw data in spreadsheet format.